Yesterday, we saw a decent upside recovery above the $0.3250 resistance in ripple price against the US Dollar. The XRP/USD pair even traded above the $0.3300 resistance area. A new weekly high was formed at $0.3384 and later the price corrected lower. It declined below the $0.3300 support and the 100 hourly simple moving average. Sellers also pushed the price below the 50% Fib retracement level of the recent wave from the $0.3109 low to $0.3384 high.
During the decline, there was a break below a key bullish trend line with support at $0.3250 on the hourly chart of the XRP/USD pair. The pair is now trading well below $0.3260 and the 61.8% Fib retracement level of the recent wave from the $0.3109 low to $0.3384 high. It tested the $0.3200 support and corrected a few points recently. However, there is a strong resistance formed near $0.3250, $0.3260, and the 100 hourly SMA. Moreover, the broken trend line may also stop gains near $0.3270. Finally, there is a short term connecting bearish trend line with resistance at $0.3265 on the same chart.
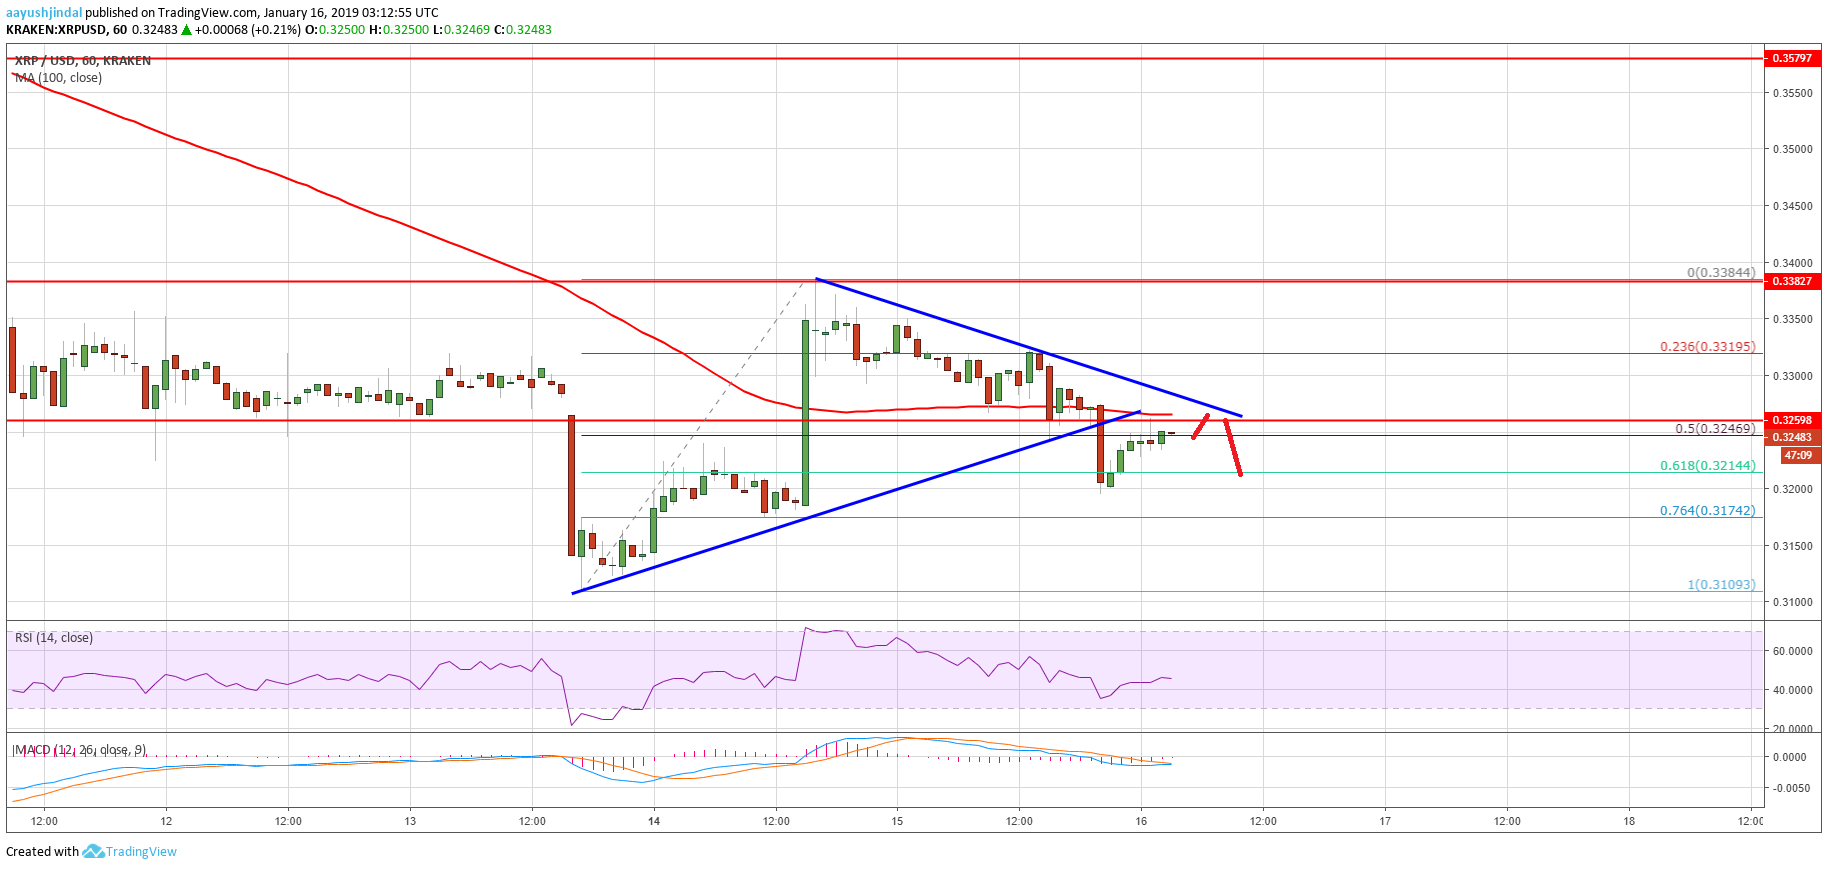
Looking at the chart, ripple price seems to be trading near a key turning point above $0.3200. It could either break the $0.3260 and $0.3270 resistance levels or decline below $0.3200. On the upside, a break above $0.3270 may push the price towards $0.3350 and $0.3380.
Technical Indicators
Hourly MACD – The MACD for XRP/USD may make an attempt to move in the bullish zone.
Hourly RSI (Relative Strength Index) – The RSI for XRP/USD is currently just around the 50 level.
Major Support Level – $0.3200
Major Resistance Level – $0.3270