


Chart and pattern analysis has been widely used to try to predict when Bitcoin and crypto markets will hit the bottom. A huge range of technical indicators combined with historical snapshots are put to work in order to tell us when the optimum time to get back in is. The latest price prediction tool is a fractal which is when a pattern repeats itself on a smaller scale.
Fractals can be seen in all forms of nature and are repeated in financial markets. Mathematical patterns and an element of chaos theory indicate that a random cyclical action will produce a fractal. A recent Forbes piece has applied this pattern to Bitcoin charts stating that fractal patterns tend to repeat at different scales showing nested repeated versions of the same chart pattern.
Looking back at the past year or two on Bitcoin charts are not pretty but there are some similarities in the patterns. The major dump of 80% during 2018 has been repeated by another dump which is 25% of the size of the first. This is a classic example of a fractal.
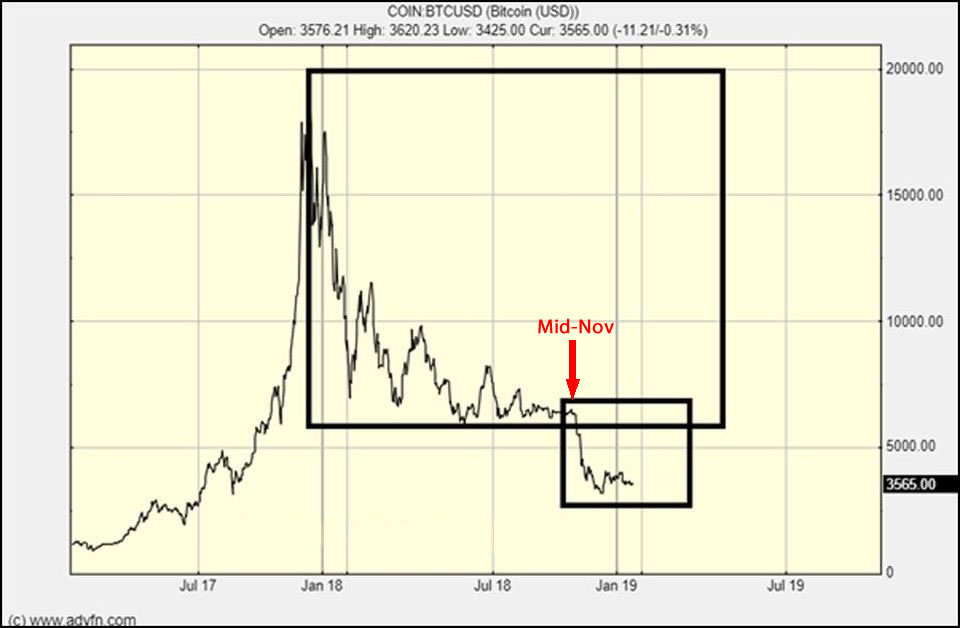
Chart from advfn.com
Using this to predict further prices, a 25% fractal of the second crash would look like this:
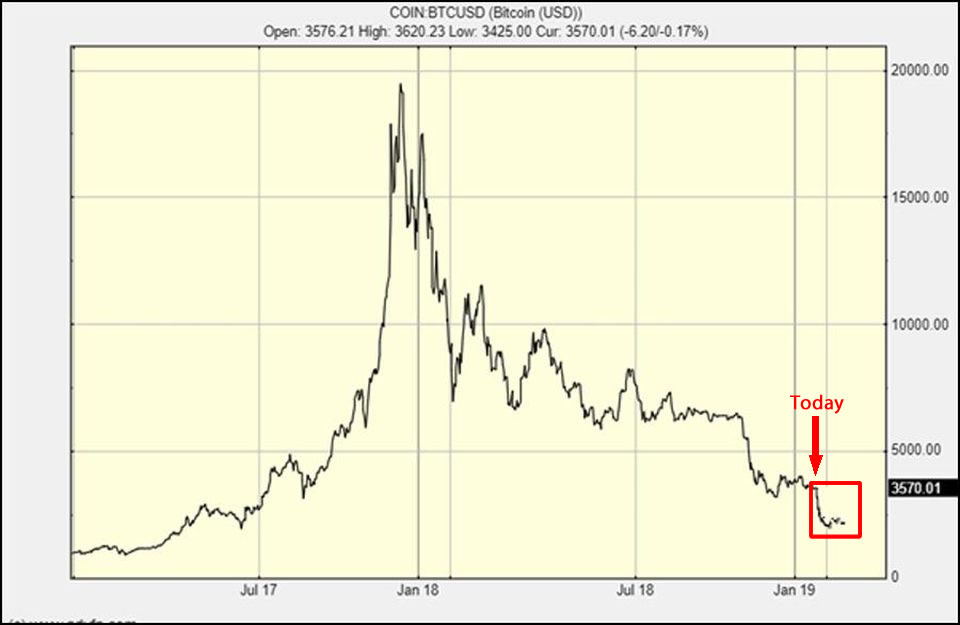
Chart from advfn.com
Each reiteration of the original pattern is 25% smaller as the losses decrease and the bottom nears. Using this to predict where that would be puts Bitcoin at around $2,500 within the next two months. Author Clem Chambers, who is the CEO of stocks and investment website ADVFN, stated that “a trading thesis is just a crude map to act as guide” before adding “predictions should only ever be used as pathways to pivot on.”
Analysts Agree: Bitcoin to Fall Further
Predictions are all we have to go on at the moment but this fractal hypothesis does line up with a number of other analysts who have arrived at similar bottom figures using different techniques. Prominent technical analyst, Murad Mahmudov, has predicted that the pain will go even deeper than $2,500 with a final bottom of $1,800 by the end of Q2 this year.
Earlier this month he correctly predicted that Bitcoin would not overcome a huge wall of resistance at $4,000 and would make further declines. Other analysts have also predicted sub-$3,000 bottoms for Bitcoin before reversal. Today BTC is struggling to break resistance at $3,600 so the two figures above are not that far away.
The consensus among technical and theoretical analysts is more short term anguish for Bitcoin. Specific figures aside, they all agree on the sentiment that it will rise up from this bottom as the snow from the crypto winter melts later this year and these losses fade into memory.